Department Detail Report In The JS Help Desk!
Department Detail Report
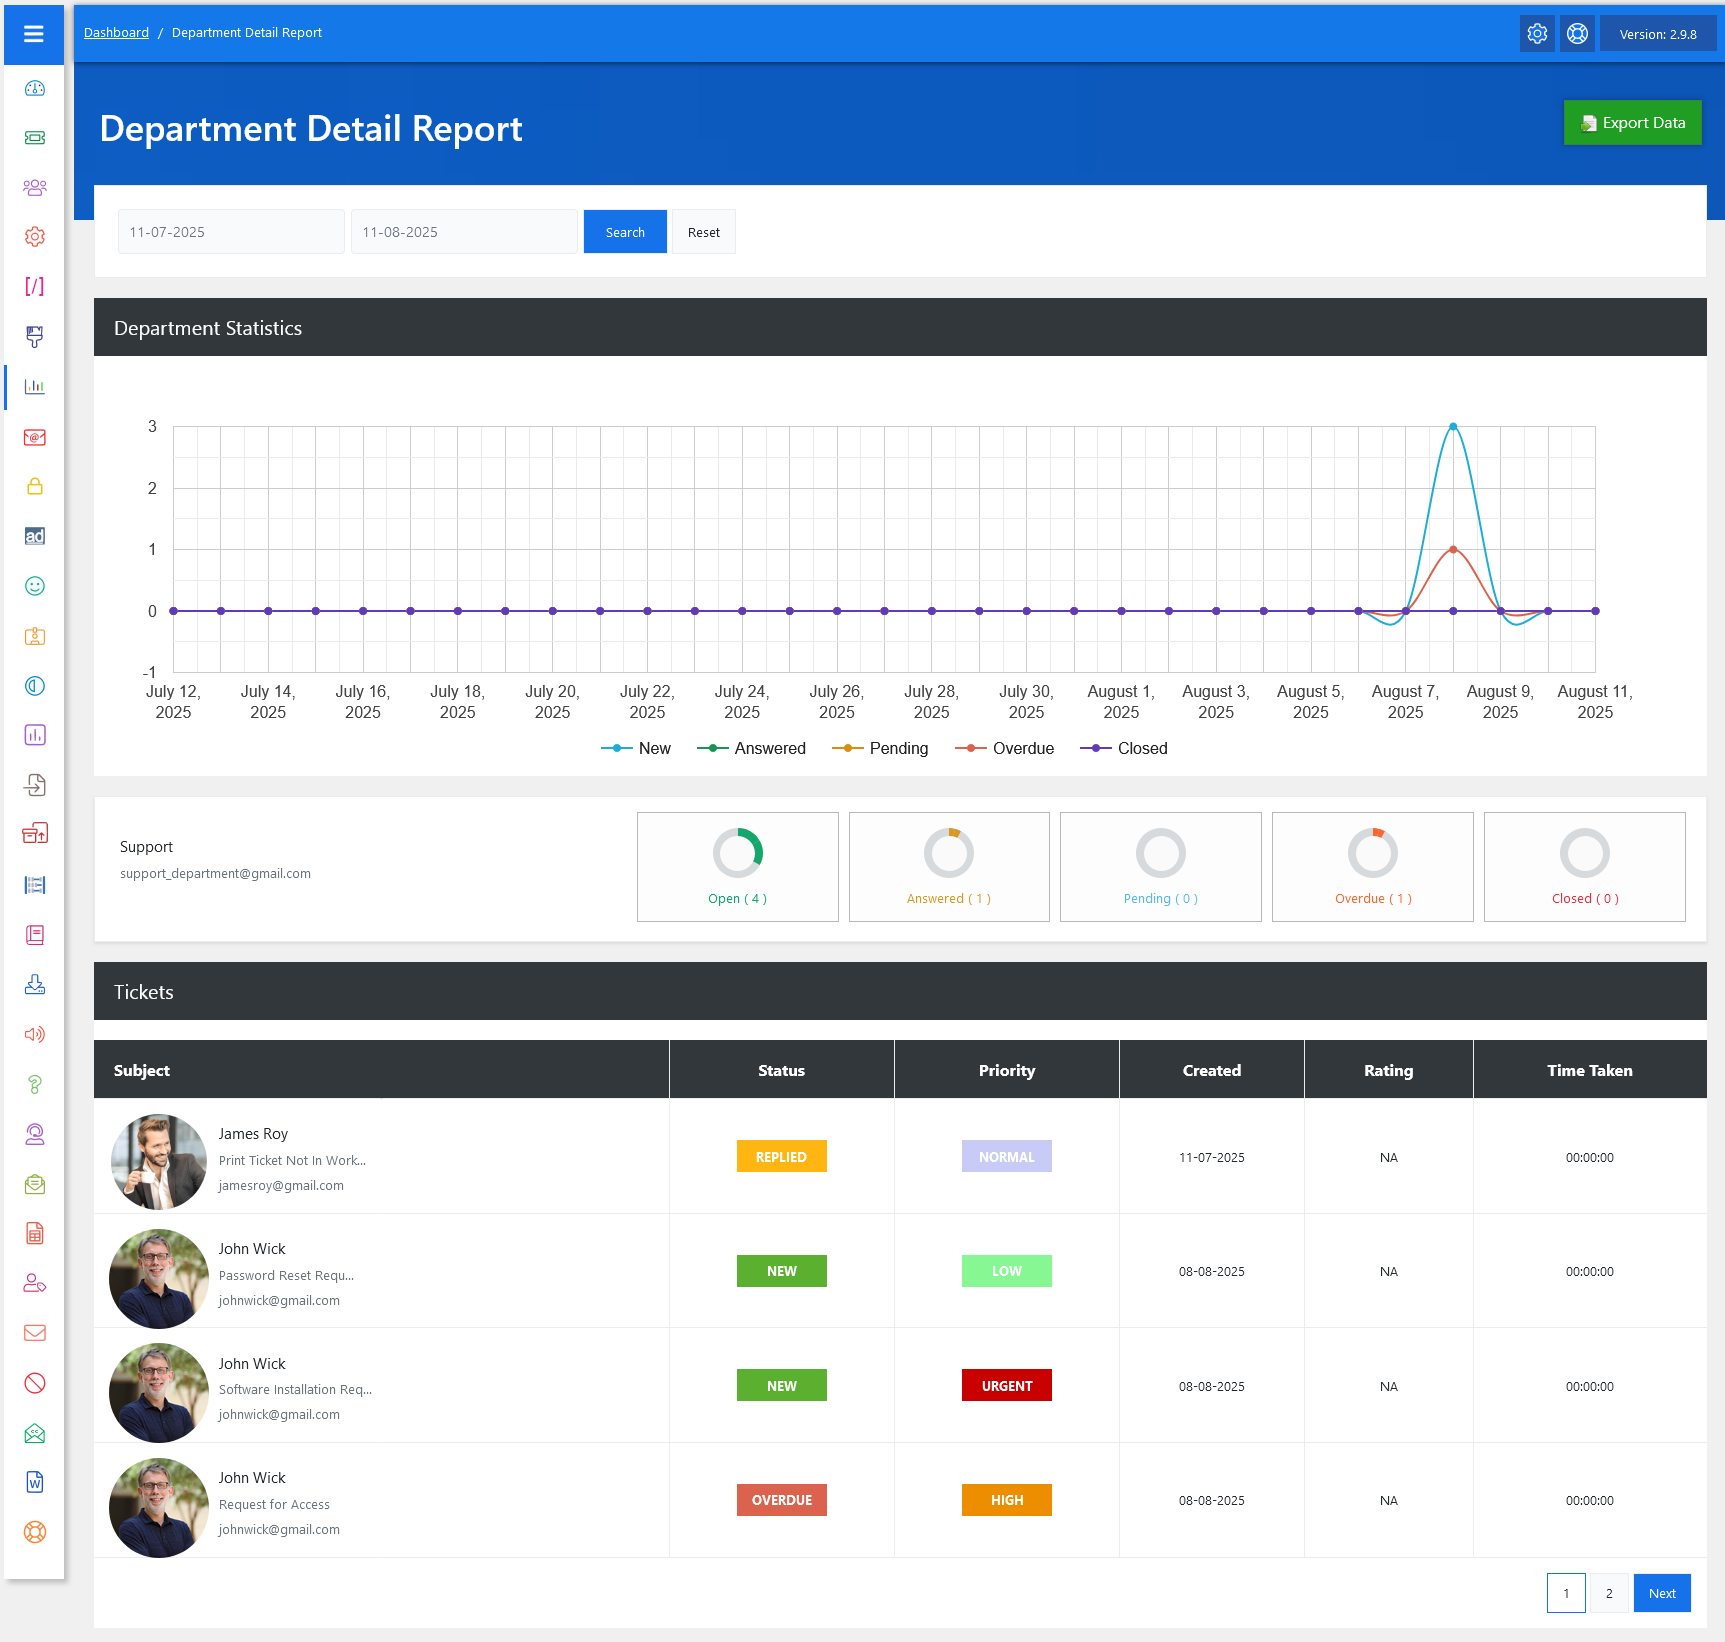
From your admin dashboard, navigate to Admin Dashboard > Dashboard Menu > Department Reports. To view the department detail page, click on the department name. This page provides us with details about a department and its tickets. The Department Detail Report in JS Help Desk is a powerful tool designed to provide a clear and detailed overview of all ticket-related activities within a specific department over a selected period. This report helps managers and team leads analyze performance, identify bottlenecks, and make informed decisions for improving customer support efficiency.
Search

You can select your desired date range using the date picker at the top, then click the Search button to view the department’s statistics for that period. The Reset option allows you to quickly revert the filters to the default and start a fresh search.
Graph

At the heart of this report is the Department Statistics section, which presents a visual graph of ticket trends over time. Different colored lines represent ticket statuses such as New, Answered, Pending, Overdue, and Closed, allowing you to quickly spot activity spikes or inactivity periods. For example, if you see a sudden rise in “Overdue” tickets, it could indicate that the team needs more resources or process adjustments to handle the workload effectively.
Department

Below the graph, you’ll find a summary widget section that gives quick, at-a-glance figures for ticket counts in each status category. These include Open, Answered, Pending, Overdue, and Closed. Each widget also shows the number of tickets in that status during the selected time range. For instance, if the Open widget shows “4,” it means there are currently four tickets in that department awaiting resolution.
Tickets
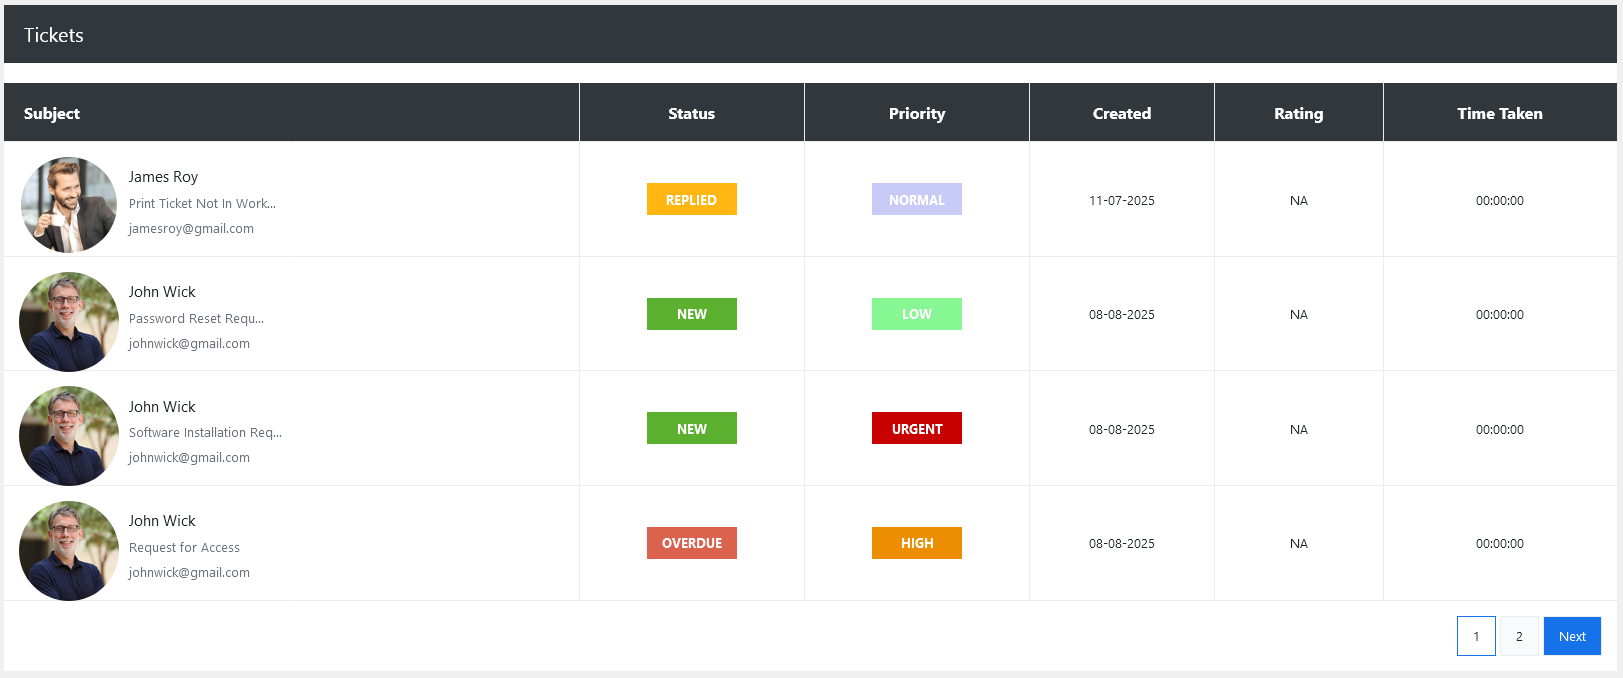
The Tickets table lists individual tickets in detail, making it easy to drill down into specific cases. Each row contains the ticket’s subject, status, priority level, creation date, rating, and time taken. This structured view helps support agents and managers to see not just the ticket volume but also the nature of issues being reported.
Export Data
Another useful feature is the Export Data button located in the top right corner. This allows you to download the entire report for offline analysis, record-keeping, or sharing with others. For example, you could export a monthly report to present at a team meeting, showing improvements in ticket resolution time or identifying recurring issues that need process changes.