Agent Detail Report In The JS Help Desk!
Agent Detail Report
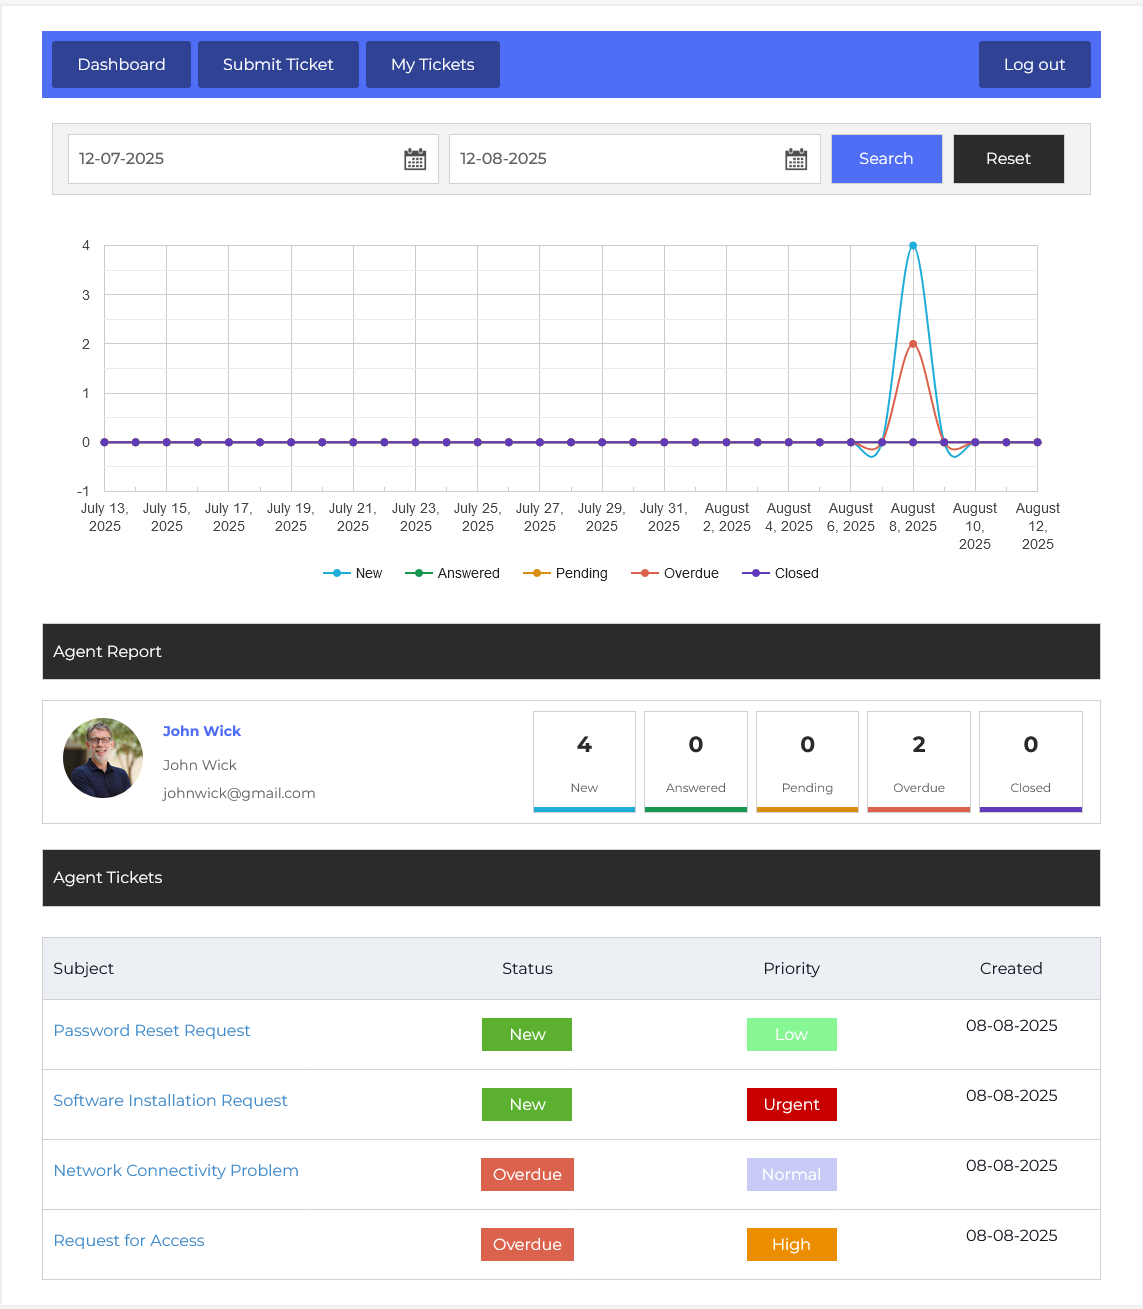
From your agent dashboard, navigate to Agent Dashboard > Dashboard Menu > Agent Reports. To view the agent detail page, click on the agent name. This page provides us with details about an agent and its tickets.
Search

You can filter reports by selecting a date range. This helps in generating time-bound reports, such as checking an agent’s performance for the current week or comparing it to last month. The system will only display ticket activity for that agent within the specified dates.
Graph
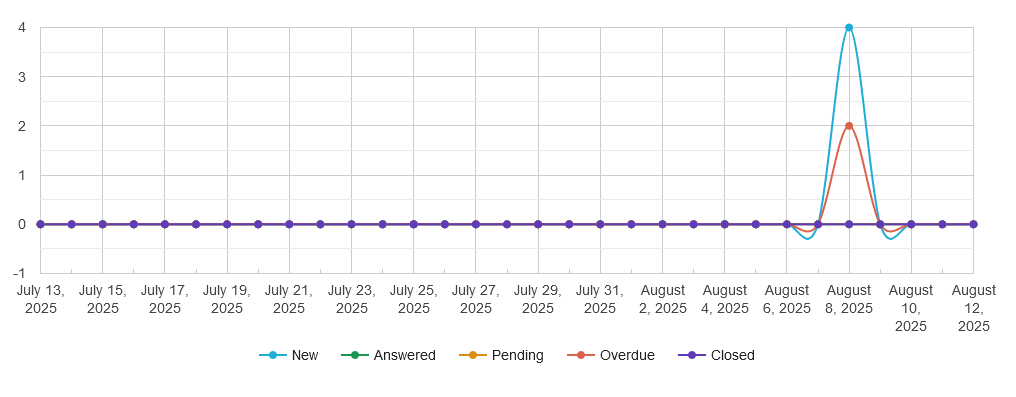
The Agent Statistics section includes a line chart that visualizes ticket trends over time. Each line represents a different status, like “New” in blue, “Answered” in orange, “Pending” in yellow, “Overdue” in red, and “Closed” in purple. By looking at the chart, you can easily identify activity spikes or drops.
Agent Report
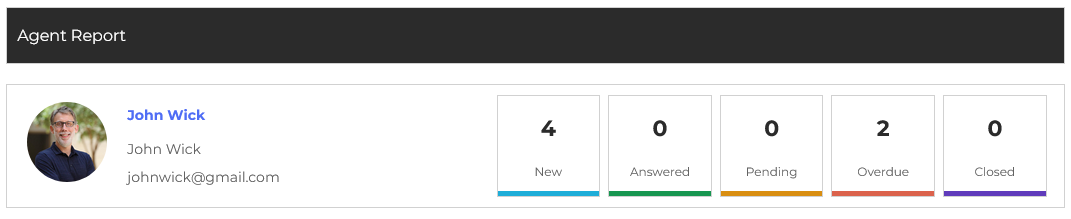
Beneath the graph, you will find the agent’s profile details, including their name, photo, and email address. This personalized display makes it easy to confirm which agent’s data you are reviewing. The status counters next to the profile—Open, Answered, Pending, Overdue, and Closed—show exact ticket counts. This gives a quick snapshot of the agent’s current workload. For example, if “Open” shows 4, it means the agent currently has four active tickets to handle.
Agent Tickets
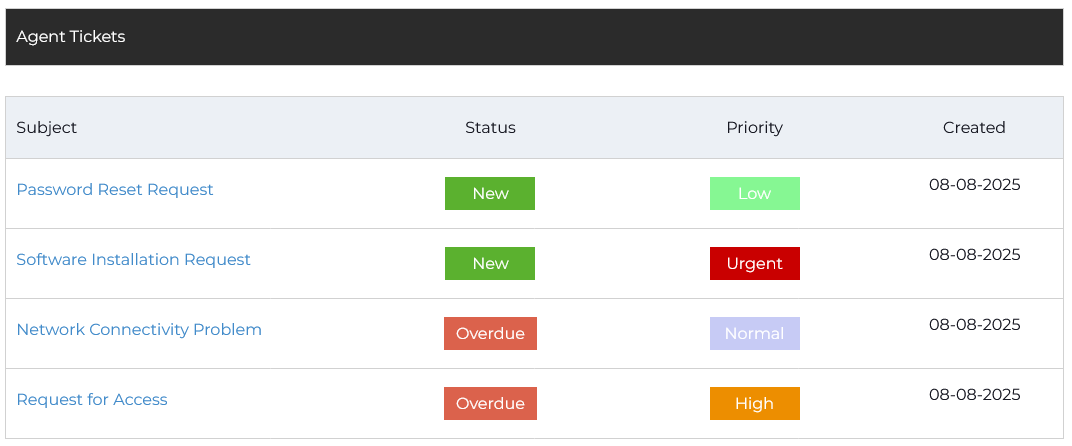
The Tickets table lists all tickets assigned to the agent within the chosen date range. Each row shows important details such as Subject, Status, Priority, and Created Date. This granular data is particularly useful for deeper performance analysis.