Satisfaction Report In The JS Help Desk!
Satisfaction Report
When a ticket is closed, JS Help Desk can prompt the customer to submit a satisfaction response, such as a rating (for example, Excellent, Happy, Normal, Sad, or Angry. Each response is stored and linked to the related ticket, agent, and department. For example, if a customer rates a resolved ticket as “Good,” that feedback is automatically included in the Satisfaction Report.
From your admin dashboard, navigate to Admin Dashboard > Dashboard Menu > Satisfaction Report. The Satisfaction Report in JS Help Desk helps administrators measure how happy customers are with the support they receive. This report is generated from customer feedback submitted after a ticket is resolved, usually in the form of ratings or satisfaction responses. By reviewing this report, teams can understand overall service quality, identify strengths, and spot areas that need improvement.
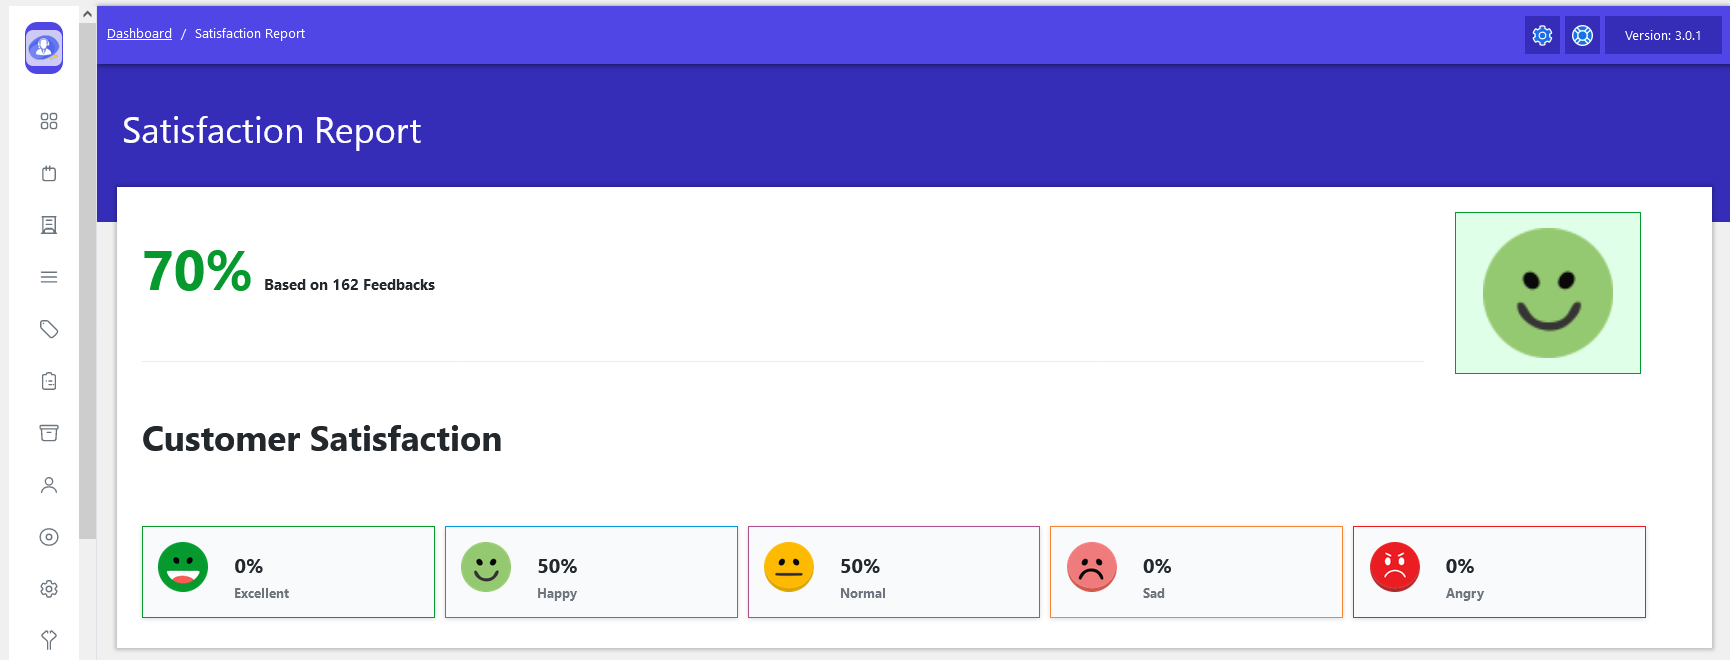
The Satisfaction Report in JS Help Desk provides a clear overview of how customers feel about the support they receive after their tickets are resolved. This report is based entirely on customer feedback collected through satisfaction responses, making it a reliable indicator of service quality. At the top of the report, an overall satisfaction percentage is displayed, such as 70% based on 162 feedback, giving managers an instant snapshot of customer sentiment across the system.
JS Help Desk categorizes customer feedback into multiple satisfaction levels, such as Excellent, Happy, Normal, Sad, and Angry, which are visually represented using intuitive smiley icons. For example, in the shown report, 50% of customers selected Happy, while another 50% chose Normal, and no negative responses were recorded.