Department Reports In The JS Help Desk!
Department Reports
From your admin dashboard, navigate to Admin Dashboard > Dashboard Menu > Department Reports. The Department Report feature in JS Help Desk provides a clear and comprehensive view of your help desk’s performance across different departments. This feature allows you to monitor ticket activity for a specific date range, giving you actionable insights into the workload, response rates, and resolution efficiency of each department.
Search

By selecting the desired start and end dates and clicking Search, the report dynamically updates to show the relevant data. The Reset button can be used to clear filters and return to the default view.
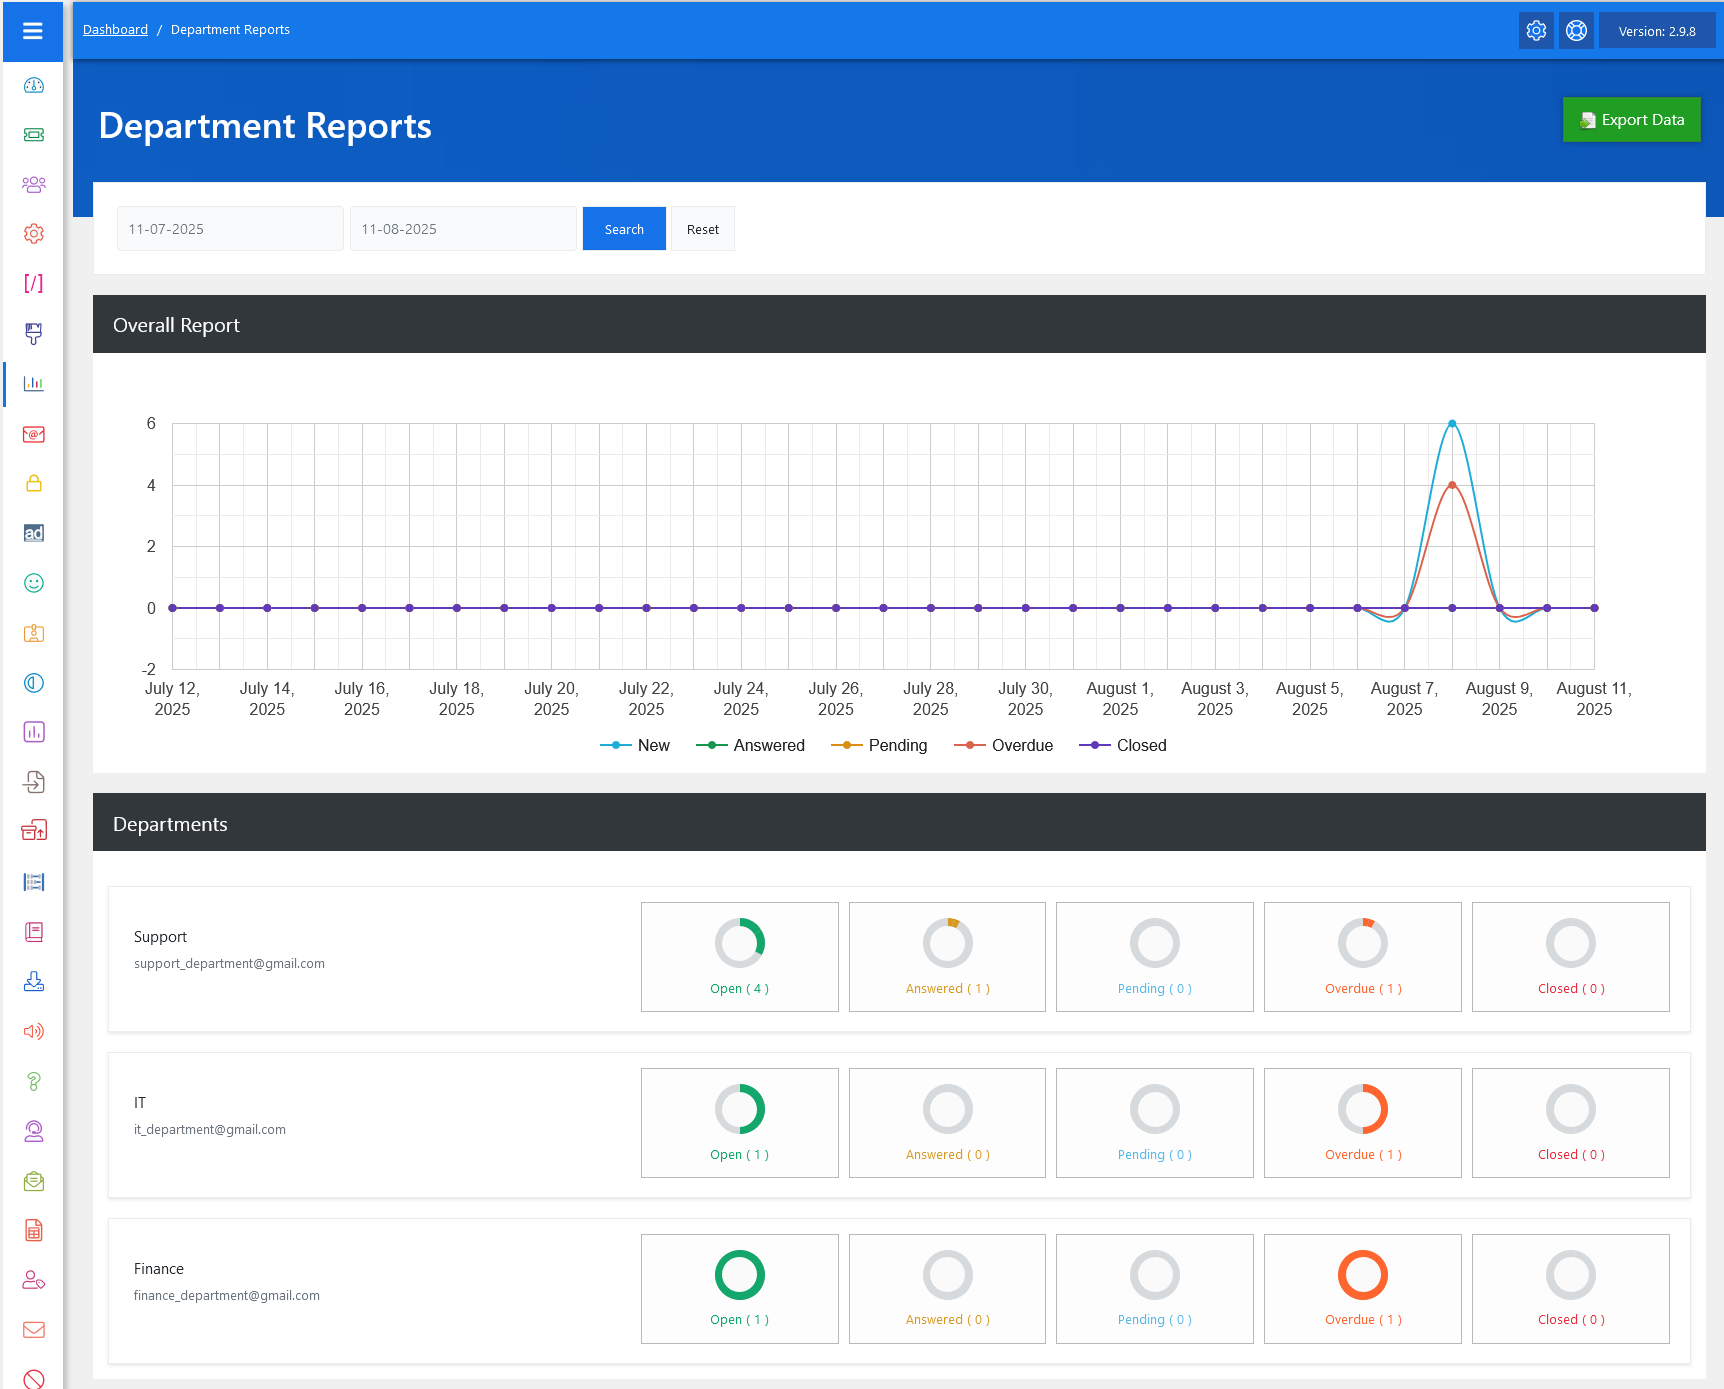
Graph
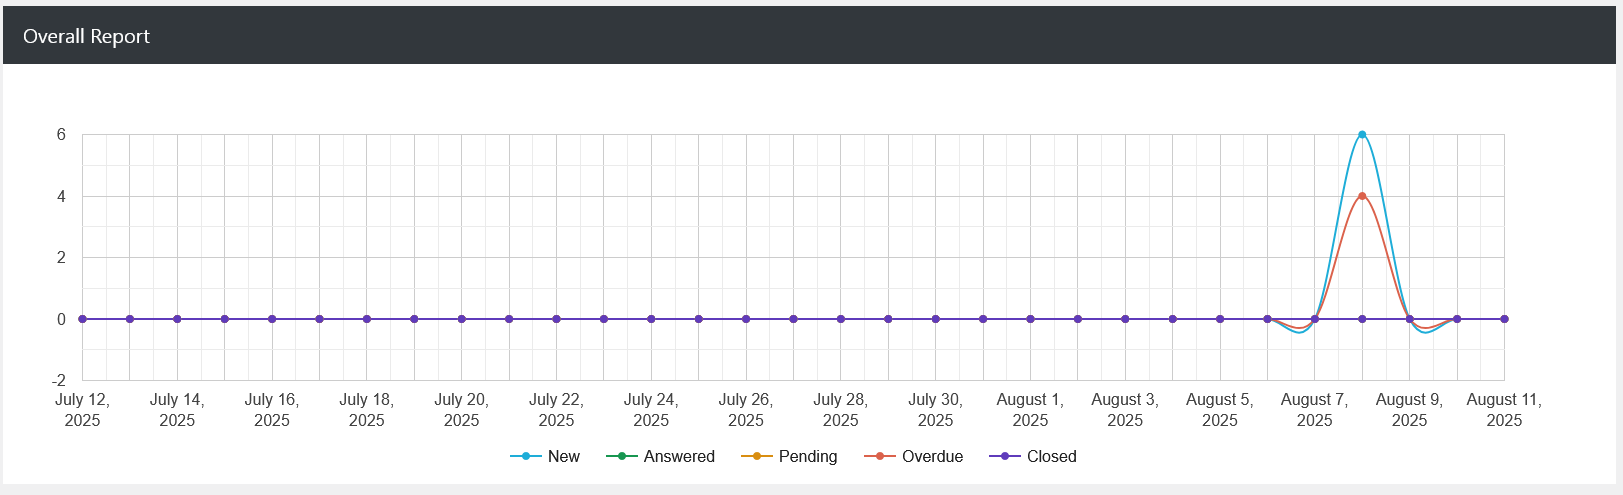
At the top, you will find the Overall Report graph, which visually represents ticket activity trends over time. Different colors indicate ticket statuses such as New, Answered, Pending, Overdue, and Closed. This helps managers quickly identify spikes in activity, such as a sudden increase in new tickets or problem areas like overdue tasks.
Departments
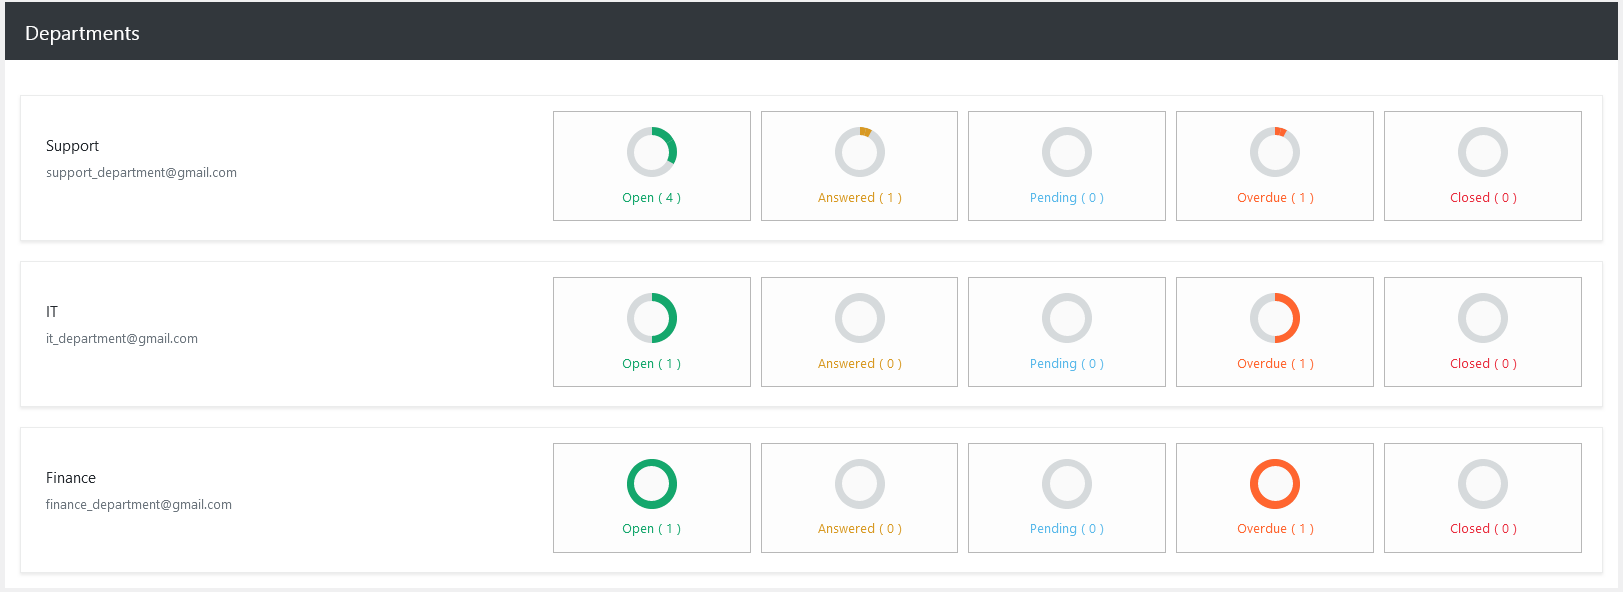
The Departments section displays a breakdown of ticket statuses for each department in a clear, segmented format. Each department is listed with its contact email and has individual status indicators for Open, Answered, Pending, Overdue, and Closed tickets. For example, the Support Department may show 4 open tickets, 1 answered, 0 pending, 1 overdue, and 0 closed, allowing managers to see at a glance where attention is needed.
Export Data
Additionally, there’s an option to “Export Agents Reports Data” at the top right of the “Agent Reports” page. The Export Data button in the top right allows you to download the report for offline review or record keeping. This is particularly useful for monthly performance reviews. The exported file contains all visible data.