Overall Statistics In The JS Help Desk!
Overall Statistics

From your admin dashboard, navigate to Admin Dashboard > Dashboard Menu > Overall Statistics. The Overall Statistics feature in JS Help Desk provides a comprehensive visual summary of your help desk’s activity, allowing administrators, managers, and team leads to monitor performance at a glance. This dashboard compiles key metrics into charts, graphs, and counts, enabling quick decision-making and effective workload management. It’s designed to save time by bringing all the crucial operational data into a single, easy-to-read interface.
Top Rings
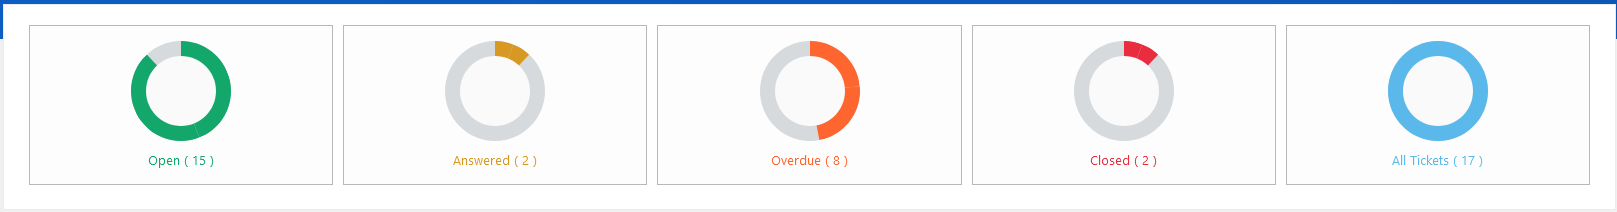
At the top of the dashboard, you’ll see quick status indicators showing the number of Open tickets, Answered, Overdue, Closed, and the total All Tickets count. For example, if you see 15 tickets open, 8 overdue, and 2 closed, it immediately tells you there’s work pending and some items requiring urgent attention.
Ticket By Status and Priorities
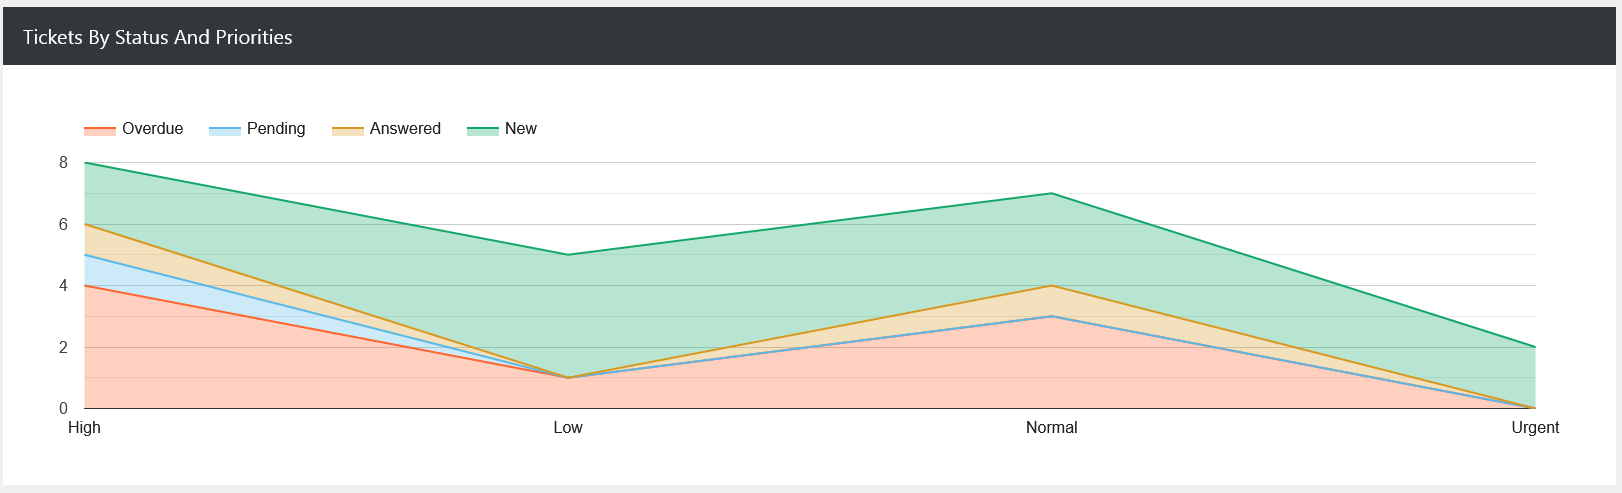
The Tickets by Status and Priorities chart offers a layered view of how tickets are distributed across statuses such as New, Pending, Answered, and Overdue while also mapping them against their urgency levels: High, Low, Normal, and Urgent.
Tickets By Departments and Tickets By Priorities
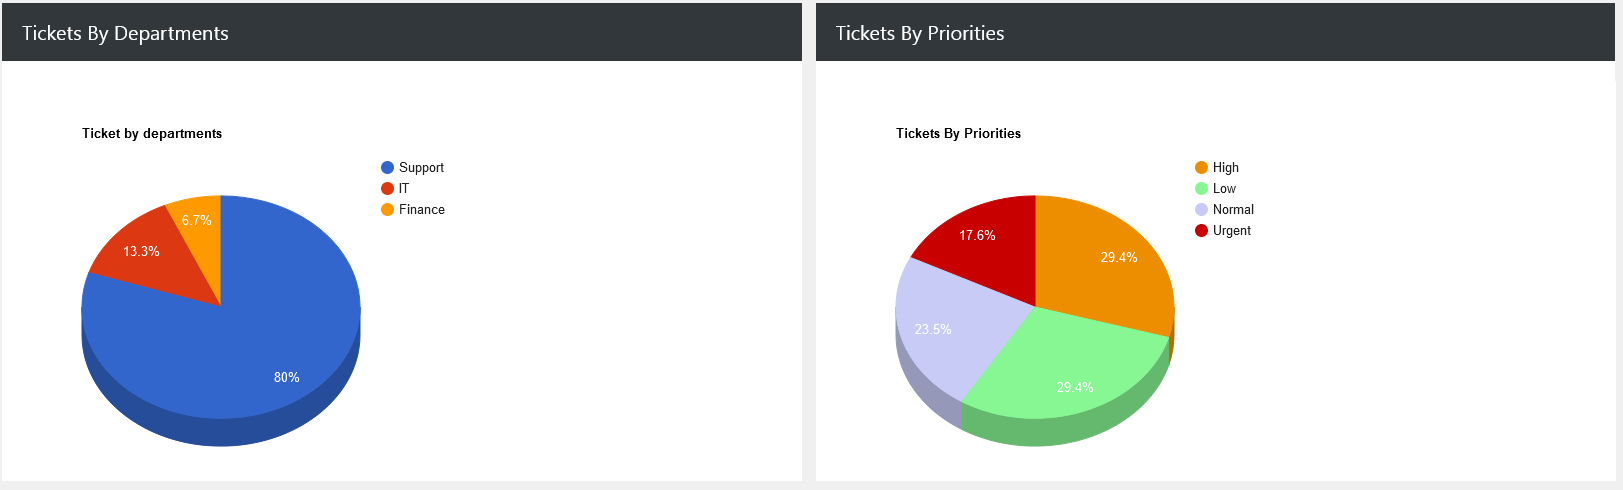
The Tickets by Departments pie chart breaks down ticket volumes by department, making it clear which teams are handling the bulk of the workload. If 80% of tickets belong to the “Support” department and only 13% to “IT,” it indicates where most customer issues originate. This can help with resource allocation, staffing adjustments, or even targeted training.
Similarly, Tickets by Priorities visualizes the urgency distribution across all tickets: High, Low, Normal, and Urgent. For example, if 23% of tickets are normal priority but 29% are high priority, managers might decide to reassign more team members to handle the high-priority cases faster. This data-driven prioritization ensures critical issues are not lost in the queue.
Ticket By Status and Ticket By Channel
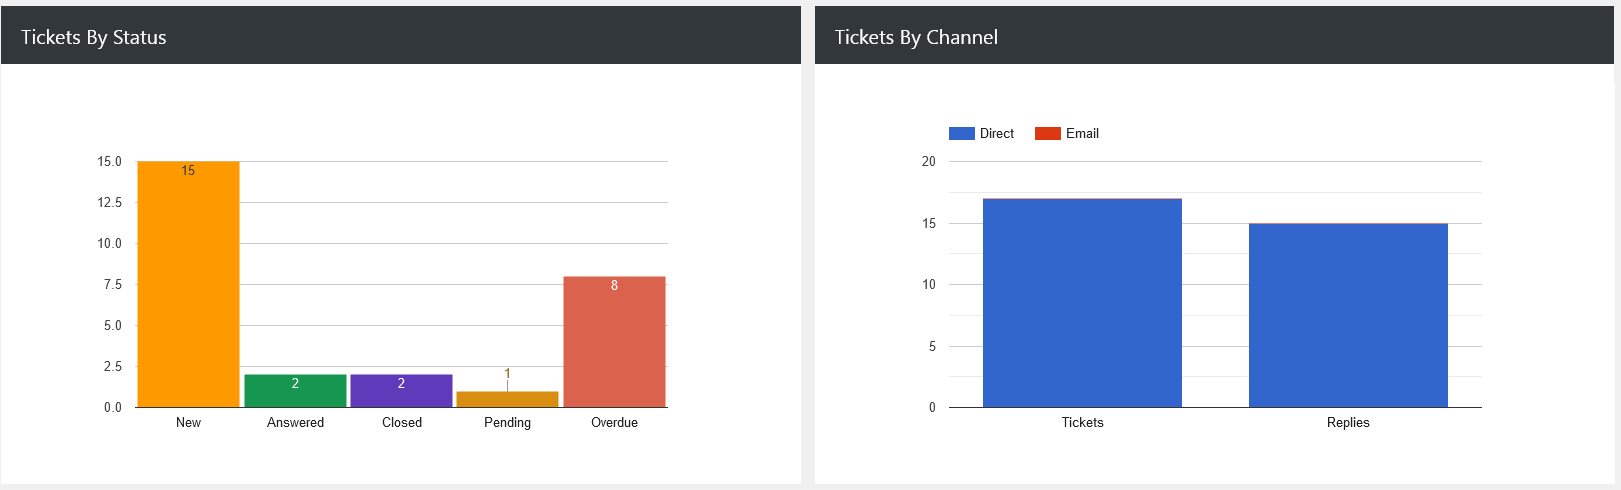
The Tickets by Status bar chart gives a clear count of how many tickets are New, Answered, Closed, Pending, or Overdue. If you have 15 new tickets and 8 overdue, but 2 answered, it may indicate a response delay, prompting managers to check team workloads or processes.
Tickets by Channel breaks down how tickets are coming in, whether through direct submission or email. For example, if the majority are coming via email, it might suggest a need to improve the direct submission experience on your website or customer portal to balance incoming requests.
Tickets By Agents
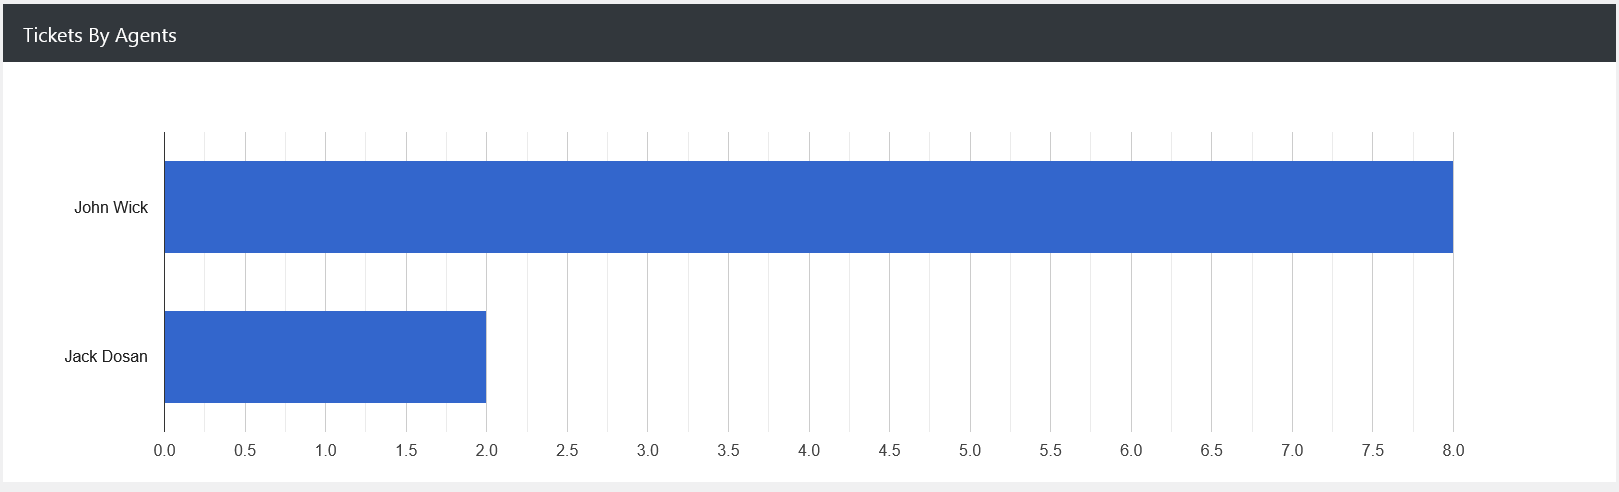
Finally, the Tickets by Agents bar chart showcases individual agent performance by showing how many tickets each has handled. If one agent is managing significantly more tickets than others, managers can redistribute workloads to avoid burnout and ensure consistent service quality. This transparency helps maintain fairness and efficiency in the team.
Export Data
Additionally, there’s an option to “Export Overall Statistics Data” at the top right of the “Overall Statistics” page. The Export Data feature in JS Help Desk allows you to quickly download your help desk ticket’s information in a structured file format, making it easier to back up, share, or analyze your records outside the system. This is especially useful for reporting.